Recent searches
Search options
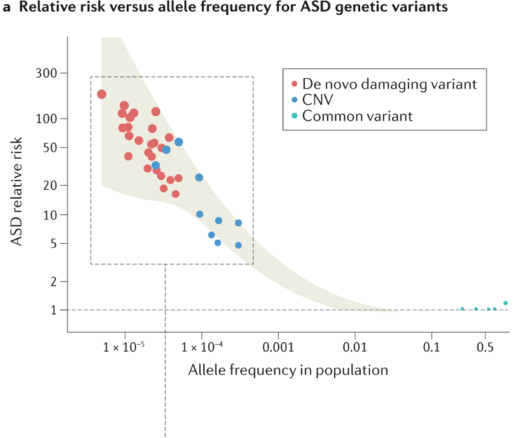
Big fan of this plot showing ASD gene 'risk' on y-axis (i.e. the relative increase in diagnosis likelihood if you have a genetic variant) vs variant prevalence on x-axis (fraction of general population with that genetic variant).
Some high-risk genes that are rare (top left) and other low-risk genes that are common in population.
Common phenomenon seen in many disorders: high impact mutations don't often get propagated to the next generation.
From Willsey et al 2022: https://www.nature.com/articles/s41583-022-00576-7
@MolemanPeter yes it's nice! Makes clear how mysterious ASD still is. Personally I am excited to work on the puzzle, feels like the field is making good progress due to the genetics discoveries but still needs a conceptual breakthrough or two
@cian @MolemanPeter FYI, in terms of genetics, a very similar situation also applies to stuttering, another neurodeveloomental condition.
@StutteringLabUW @cian Thx! I think it applies to all neurodevelopmental conditions. And it appears to apply also to other psychiatric disorders.
@cian
This is indeed a great plot! Thanks for sharing it.
@NicoleCRust @cian classic QG result!
@NicoleCRust @cian quantitative genetic — you see this inverse relationship between allele effect size and frequency across domains (not just disease, or humans). For exactly the reasons Cian gave — alleles of large effect either go extinct or sweep to fixation quickly.


